Welcome to KnowHow Daily!
Practical guides, money-saving tips, tech solutions, government benefits, and useful information for everyday life.
Welcome to KnowHow Daily!
Practical guides, money-saving tips, tech solutions, government benefits, and useful information for everyday life.


Google Search Console now reports web multimodal search activity from Lens, Circle to Search, image uploads, and image searches. Here's how to find and interpret it.

Google Search Console is adding a new way to separate traffic that begins with an image or visual context from traditional typed web searches. Google announced the rollout on September 24, 2026, and says the data is becoming available globally.
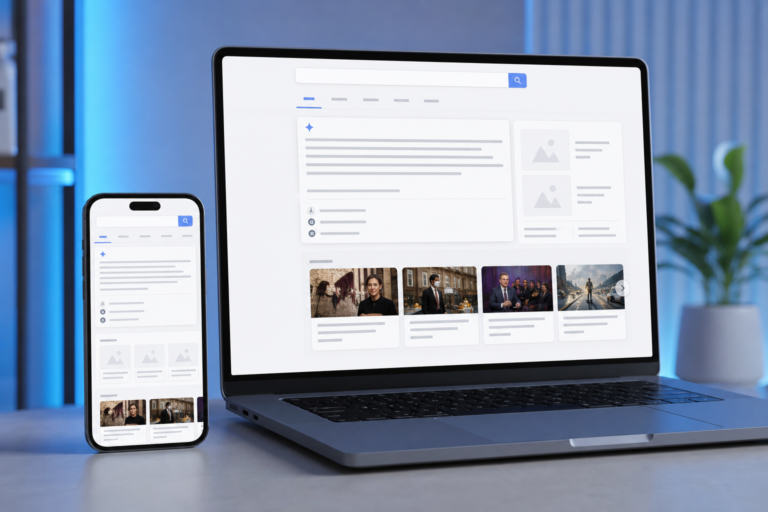
The new report covers web multimodal searches that use Google Lens, Circle to Search on Android, image uploads to Google Search, and Chrome’s right-click “Search this image” feature. In practical terms, it helps show whether people are reaching your site after starting with something they saw rather than a phrase they typed.
The distinction matters because visual discovery can produce different kinds of visits. Someone might photograph a product, circle an object in a video, upload an image to identify a plant, or search for similar artwork. If Google’s results include a link to your site and the user clicks through, that activity can appear in Search Console’s performance data.

Open the Performance report for Search results and look at the filters along the top. Google says the new multimodal search type filter will appear alongside the existing search-type options as the rollout reaches your property. The same type of reporting is also being introduced in the Performance report for Generative AI features.
You may not see the filter immediately, and an empty result does not necessarily mean your site has a technical problem. Google says the metrics will start appearing when a site receives traffic from the covered multimodal searches.
Once the filter is available, select the multimodal option and review the standard performance metrics. Search Console’s report can show clicks, impressions, click-through rate, average position, queries, pages, countries, devices, and dates, depending on the view and the amount of data available.
The first useful question is simple: which pages are receiving visibility from visual searches? Open the Pages tab and sort by impressions or clicks. This can reveal product pages, tutorials, recipes, location guides, design posts, or other content that Google connects with image-led searches.
Next, compare impressions with clicks. High impressions and low click-through rate may mean that your page is appearing as a useful reference, but the result title or description is not giving searchers a strong reason to visit. It can also mean the visual search satisfies part of the user’s need directly on Google’s results page.
Look at queries carefully, too. A visual search may produce a query that doesn’t resemble the wording a writer would use in a keyword tool. The query might be broad, descriptive, or related to an object shown in an image. Treat the query as context rather than proof of exactly what the user intended.
Search Console data also has normal reporting limitations. Totals can differ depending on whether the report is aggregated by property or by page, and anonymized or low-volume queries may not appear in full. A sudden change should be checked against the date range, device mix, country, and any recent content or image changes before you draw a conclusion.
The new report isn’t a separate ranking score for images, and it doesn’t prove that a particular image caused every visit. It is better understood as a performance view for a growing set of search journeys that use visual input.
For example, an outdoor retailer might find that a gear guide receives multimodal impressions because users photograph equipment or search for similar items. A food publisher might see recipe pages connected with image uploads of dishes. A home-improvement site could discover that step-by-step articles attract people who start with a picture of a damaged fixture.
Those patterns can guide editorial decisions. If a page receives visual-search impressions but few clicks, check whether the page answers the likely follow-up question quickly. Add clear descriptions, useful headings, relevant supporting images, and enough surrounding text to explain what the reader is seeing. Don’t replace helpful content with a collection of decorative images or force keywords into image descriptions.
| Traffic type | How the search begins | What the report helps you understand |
|---|---|---|
| Traditional web search | A typed or spoken query in Google’s web results | How pages perform for conventional search queries |
| Google Images search | A user opens the Images search experience | How image-result visibility and resulting page visits perform |
| Multimodal search | An image, camera view, selected screen area, or image-based action | How content performs when visual context helps create the search |
These categories can overlap in a reader’s broader search journey, but they are not interchangeable. A visitor who finds an image through Google Images is not necessarily part of the new multimodal segment. Conversely, someone who uses Lens or Circle to Search may never begin in the standard Images tab.
The update is especially useful for sites where appearance, objects, places, or visual examples are central to the content. That includes ecommerce stores, recipe publishers, travel and local sites, fashion and beauty websites, home-improvement resources, automotive publishers, museums, and tutorial-heavy blogs.
It may be less informative for a site built almost entirely around text-based reference pages, particularly if the property has little image-led search exposure. Even then, the filter is worth checking periodically because the availability of visual search features is changing across Google’s products.
For publishers in Canada and the United States, the basic Search Console workflow is the same. Country and device filters can help separate patterns, but the report does not automatically explain why one market produces more multimodal traffic than another. Consider language, product availability, local search behavior, and mobile usage before treating a regional difference as an SEO opportunity.
The most useful takeaway is that visual discovery is becoming easier to measure. The new report won’t tell you every detail about how a person used an image, but it can show whether image-led search journeys are sending meaningful visibility and visits to your site.
A. No. It reports covered searches that result in measurable visibility or clicks to your Search Console property. Google does not present it as a complete record of every Lens interaction, and low-volume or anonymized data may be limited.
A. Google is rolling the feature out globally, so availability may vary by property and account. The report may also show no data until Google records traffic from the covered multimodal search experiences.
A. No. Google Images traffic comes from the Images search experience, while multimodal search begins with visual input such as Lens, Circle to Search, an image upload, or Search this image. They should be analyzed as separate segments.
A. Not necessarily. Search Console can associate performance with pages and available query or search dimensions, but it does not provide a complete user-level explanation of the image, camera action, or visual object that initiated every search.